

📈 Bullish or 📉 Bearish?
📈 Bullish or 📉 Bearish?
Stocks ideas, the economy, and the market..

“Markets can stay irrational longer than you can stay solvent."
— John Maynard Keynes, an English economist
How weird?
The stock market (S&P 500) is approaching 7-month highs despite both the underlying economy and the forward 2023 guidance provided by multi-national companies deteriorating.
In this post I want to further explore the macroeconomic backdrop, the recent rally we’ve experienced from a technical perspective, our “bear market checklist,” as well as update you all on a few stock ideas.
No fun / cute intro — just jumping into the data.

The Macroeconomic Backdrop
Just so we’re all on the same page — I’m bearish.
As explained in this post shared April 2022 and reiterated in this post shared August 2022, I do not believe the Fed will be able to pull off a “soft landing.” To remind everyone, a soft landing is essentially the accomplishment of taming multi-decade high inflation while keeping the United States out of a recession.
For added context, inflation is a product of demand — more demand for something, higher the price (assuming constant supply).
The Federal Reserve has the ability to artificially make that demand decrease by making it harder for people and businesses to borrow money — they do this by raising interest rates on debt.
Austin, why don’t you think a soft landing can be accomplished?
Including 2022, we have experienced five inflation spikes above 8% as measured by the Consumer Price Index since 1948. Each of the previous four instances required both a recession and a spike in the unemployment rate (>6%) to quell inflation.

1948, 1951, 1973, and 1978 — throughout all four instances the US experienced both a recession and a spike in the unemployment rate (>6%).
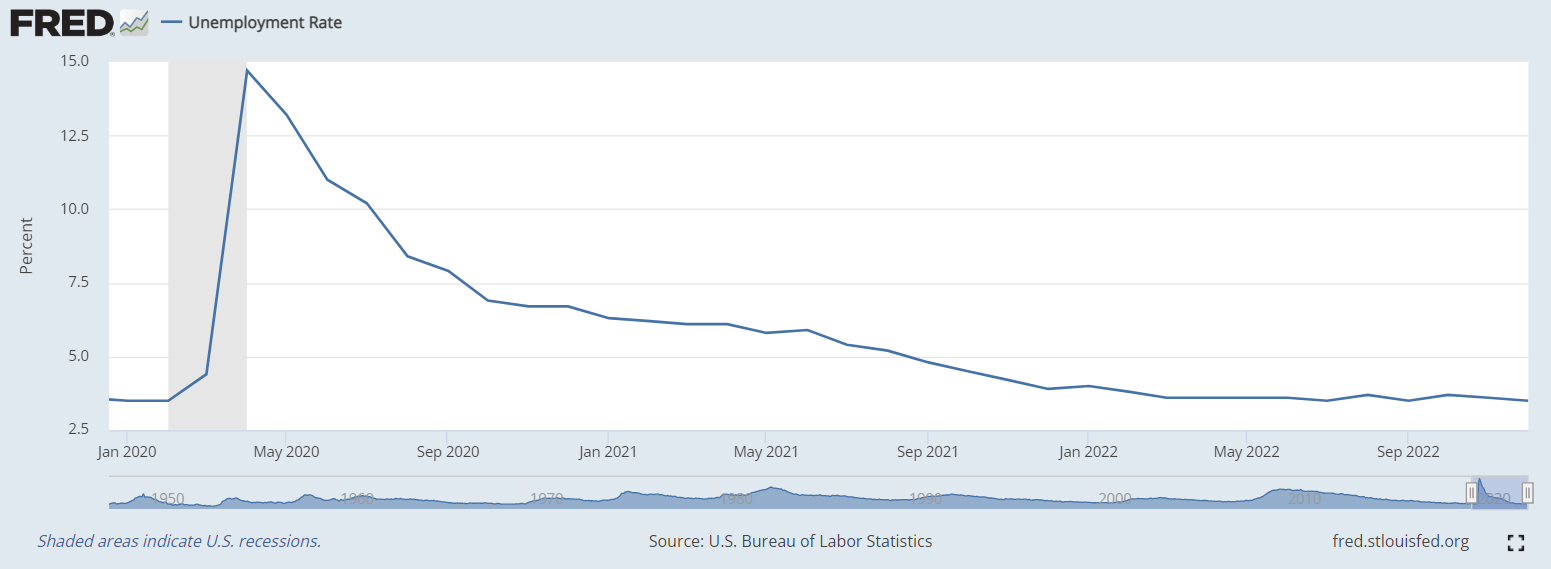
As of December 2022, the unemployment rate is at 3.5% — essentially flat since March 2022. Which is weird — because it seems like everyday we’re seeing a new headline about layoffs or a lack of hiring.


Much more goes into the definition of a recession than just the unemployment rate — what about the ISM reports?
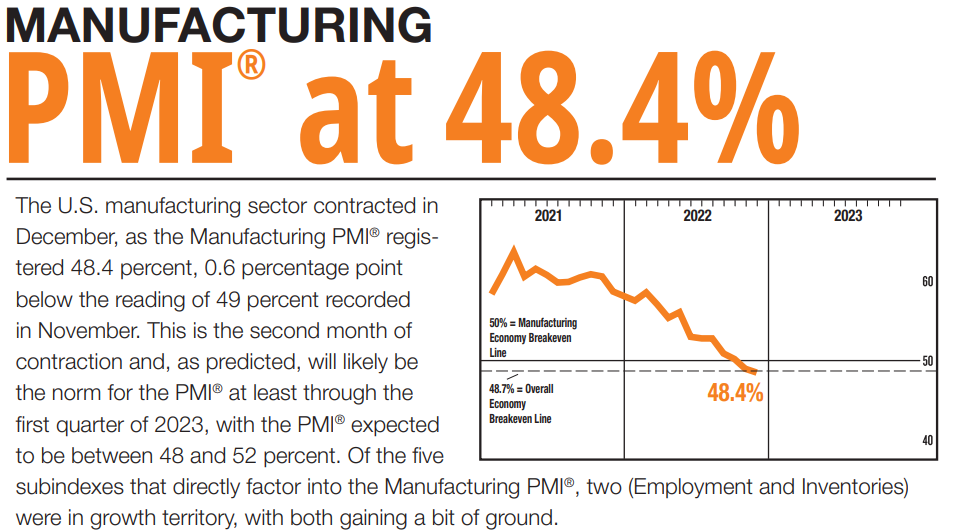
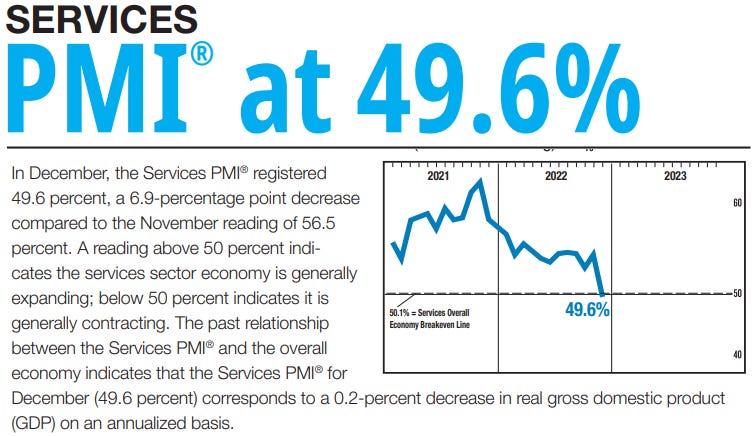
You’re right — there’s a lot that goes into the “official declaration” of a recession by the NBER. There are considerations like the Manufacturing and Services PMI — both of which are showing signs of economic contraction.
They’re not exactly “trending” in the direction either.
To really add fuel to the fire, if we turn to the recent words shared by Ataman Ozyildirim (Senior Director of Economics at The Conference Board) — we quickly learn these metrics (below) are not alluding toward economic prosperity in the slightest.

“The US LEI fell sharply again in December — continuing to signal a recession for the US economy in the near term.
There was widespread weakness among leading indicators in December, indicating deteriorating conditions for labor markets, manufacturing, housing construction, and financial markets in the months ahead.
Overall economic activity is likely to turn negative in the coming quarters before picking up again in the final quarter of 2024.”
Finally — and I’ll be the first to admit this might be too soon to tell — the forward guidance provided to us by massive companies like Microsoft, Procter & Gamble, and the Big Banks is not necessarily comforting.
As shared in this post, JP Morgan Chase and Bank of America are bolstering their credit loss reserves in anticipation of higher unemployment catalyzing defaults on consumer debt — reiterated by Ally Financial in this post.
Procter & Gamble is forecasting persistent inflation to negatively impact sales volume, and Microsoft shared with us just last week that their enterprise clients are reeling back in anticipation of macro uncertainty.
“Just as we saw customers accelerate their digital spend during the pandemic, we are now seeing them optimize that spend. Also, organizations are exercising caution given the macro uncertainty.”
Individual consumers are tightening their budgets — enterprise businesses are tightening their budgets.. but the stock market doesn’t care!
The Stock Market’s Recent Price Action
Sure — we can talk about a dozen more "economic indicators” alluding to a recession in 2023, but if I only talked about the economy in this post you all would fall asleep.
Let’s talk about the stock market — more importantly, what it’s assuming.
As I’m writing this, the stock market’s forward price-to-earnings ratio is 19.8X — but for simplicity let’s just call it 20X. For added context, this means the stock market (S&P 500) is currently assigning a valuation multiple against 2023 profits of 20X.
Let’s pretend you’re a shark on Shark Tank and an individual comes to you asking for an investment into their business. They share all of their financials with you — one of which is their expected net profits for 2023.
They’re expecting $100K in net after-tax profits in 2023, and are asking you to give their business a $2M valuation (20X profits). That’s the stock market right now.
Demanding a 20X valuation multiple on its 2023 profits.
That number means nothing without historical averages — so let’s discuss those, specifically as it relates to the market’s PE ratio during a “market bottom.”
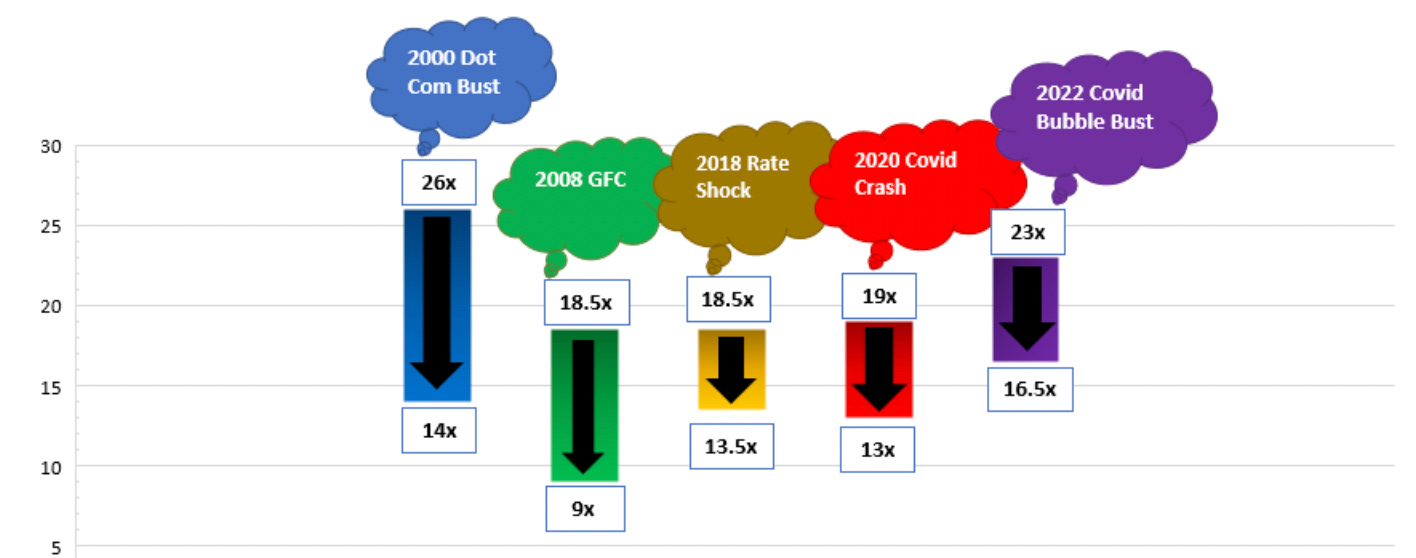
Above is an image that shows the multiple contraction the stock market experiences from peak to trough during bear markets before we officially turn the tide. During the last four bear markets, the S&P 500 traded below 14X price-to-earnings before we experience a bottom — however, the lowest we got during this recent bear market was only 16.5X.
Not to mention, it’s now currently above the peaks of the last three bear markets (2008, 2018, 2020).
The market is pricing in optimism — specifically as it relates to the Federal Reserve getting complacent and pivoting their monetary policy during the back half of the year as the US experiences a recession.
They’re not only pricing it in — they’re betting on it.

“According to Bloomberg, hedge funds have built up record long positions in short-term interest-rate futures pegged to the Secured Overnight Financing Rate.
The positioning comes amid speculation that a slowdown in inflation and economic growth will drive the Federal Reserve to start easing monetary policy in the second half of 2023.”
Despite this near-term optimism, data suggests the stock market has not yet bottomed. Thinking back to the ISM data (manufacturing and services) shared above, this data has historically been the most accurate predictor of if the stock market has truly bottomed or if there’s more downside ahead.
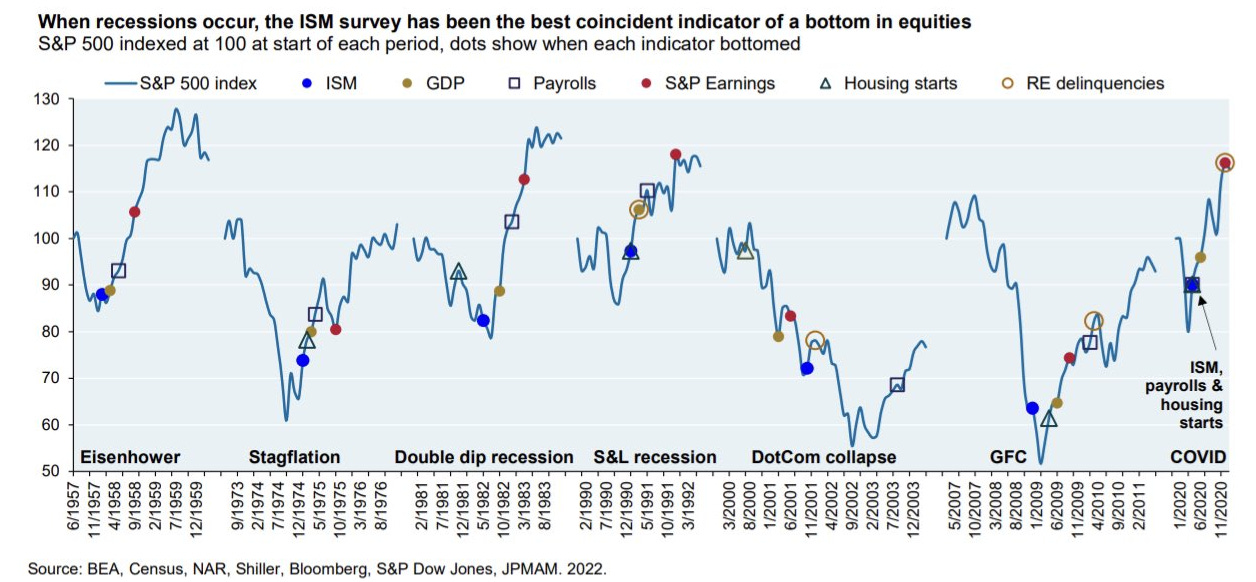
Keep an eye on those blue dots — every time you see a blue dot, that marks where the ISM data has shifted in favor of economic expansion. It’s not perfect — but there’s certainly a trend to observe.
As of December, we’re reading the opposite of this — overall trend continues to point toward near-term contraction as we maintain a value below 50.
The image below shows the average monthly returns of the S&P 500 (-0.4%) while we’re in this “below 50” area until we hit the bottom and turn the tide.

Below is an image provided by Goldman Sachs that identified the specific sectors of the stock market that tend to perform “better” than others during this exact time of ISM contraction — historically speaking.
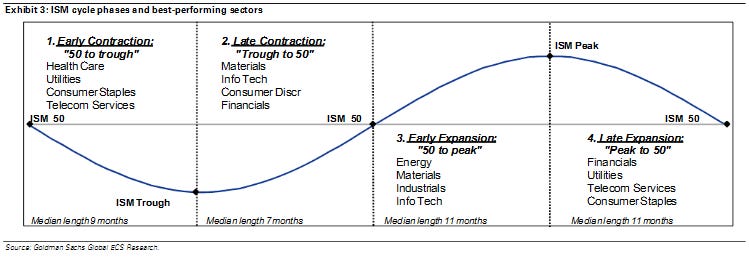
Healthcare (VHT)
Utilities (VPU)
Consumer Staples (VDU)
Telecom Services (VOX)
History tells us as long as the ISM data is declining, it’s hard for the stock market to find a true bottom.
Technical Analysis
You all know I’m not a technical analysis wizard — I leave that for Katie Stockton and her awesome (TACK) ETF. However, when Michael Burry (the guy who predicted the 2008 financial crisis) tweets about similarities between the last few months in the market and what we experienced during the Dot Com Bubble — I pay attention.

Above is the image shared by Michael Burry — seemingly highlighting a sort of double top / dead cat bounce.
Below is an image shared by Yuriy Matso — who took the image Michael shared and extrapolated upon it by showing exactly what Michael was referring to in today’s markets. In the “dead cat bounce” circled above, the market rallied +20% over three months before subsequently falling -30% shortly after.
That rally —> fall is what Michael is speculating is happening right now.

However, other “experts” on the internet are citing we’ve officially broken out of our long-standing downward trend and the S&P 500 is about to rocket higher to 5,000.

^^^ this doesn’t seem rooted in reality.
Again, not a TA wizard — I simply find the charts and present them to you, giving you a chance to interpret them yourself. I care much more about the charts that display underlying economic data, earnings, etc. as shared in the previous section.
My interpretation, for what it’s worth, is we’re not out of the woods just yet.
Stock Ideas
Is it time to bet the farm on specific stocks yet?
Not exactly — however, I think the time for maximum bearishness was late-2021 and we’re closer to a bottom in specific industries (beaten-down quality tech) than we are to the previous top experienced in 2021.
Quick valuation update — starting with this awesome chart shared by Jamin Ball.
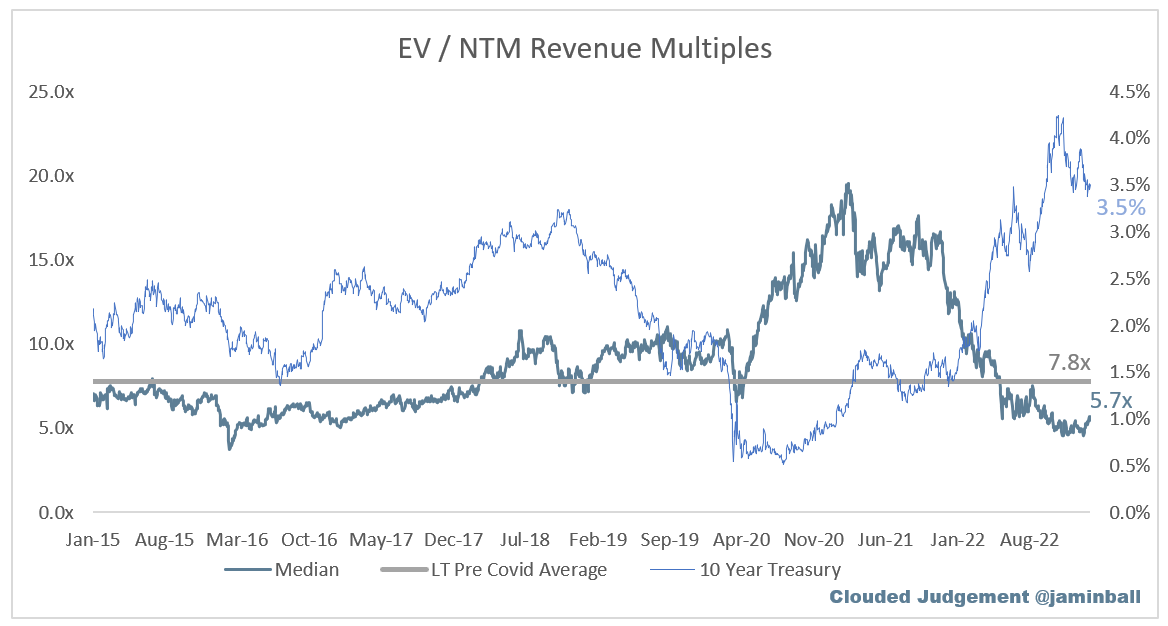
Above we see three data points displayed — the 10 Year Treasury, the median forward revenue multiple right now on SaaS businesses, and the long-standing pre-Covid average of that multiple.
I’m not saying they’ve seen a bottom — we very well can overshoot to the downside like we did to the upside in 2021 — but things seem to be priced much more reasonably now.
Here’s another chart by Jamin that categorizes the valuation multiple by forward revenue growth expectations.
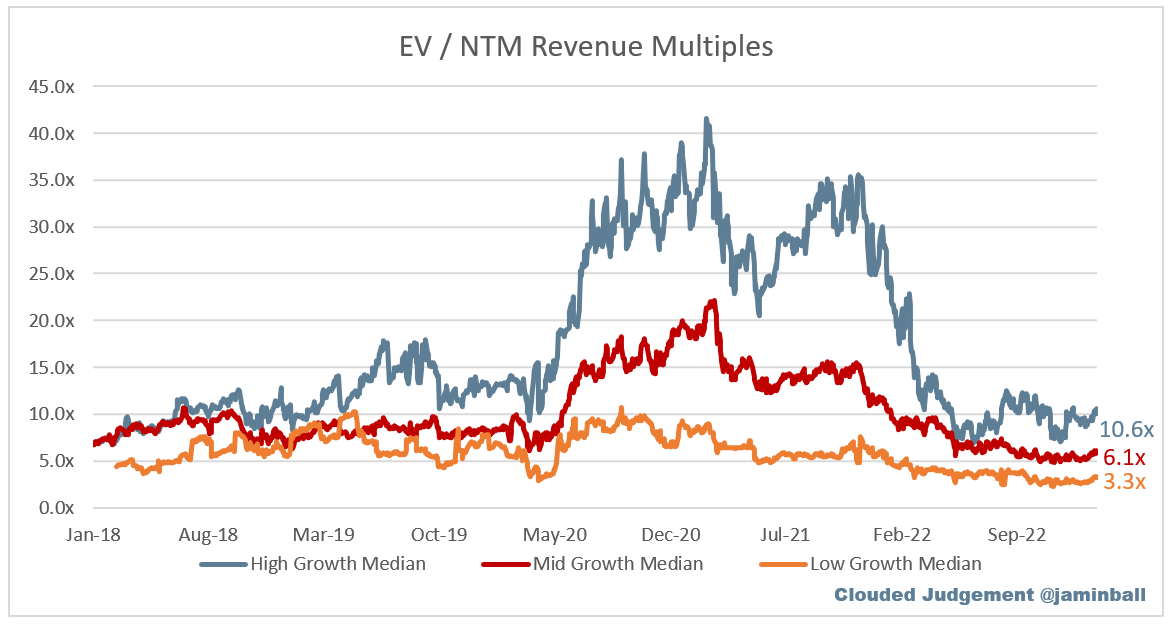
He categorizes high growth as more than +30%, mid growth +15-30%, and low growth less than +15% — high growth obviously trades at a higher multiple than low growth because of how fast these companies are growing their revenue.
But, I really like how these charts are beginning to shape up.
In the Portfolio Tracker (paying subscribers-only) I’ve shared ~15 or so “fun” stock ideas, of which, many are on that list because of how much their valuation multiples has fallen since Covid highs.
Beat-down quality technology companies are are the top of my “watchlist.”
For example, Monday.com (MNDY) is on that list — their stock price has fallen back to a reasonable 7.5X forward revenue, they’re guiding to +65% revenue growth in 2023, and their “economies of scale” continue moving in the right direction.
Another example is Snowflake (SNOW) — their stock is now trading at ~16X forward revenue, their remaining performance obligations (RPOs) currently hover around $3B, and their net revenue retention rates remain best-in-class (165%).
Another example is MercadoLibre (MELI) — their stock has actually experienced some insane YTD momentum during this bear market rally (up +49%). Despite this rally, their stock trades at ~4X forward revenue, free cash flow is expected to grow +42% in 2023 and +38% in 2024 (below).
