What’s the really Fed going to do this year? When will this non-stop speculation end?
According to the WSJ, investors in interest rate futures expect the Fed to raise rates by +25 bps two more times — once in the upcoming meeting at the end of the month, and again in the March meeting.
In December, most Fed officials projected a peak rate of 5%-5.25% — implying raises of +25 bps in at least the next three meetings.
There’s also a stark contrast surrounding when the actual pivot will take place. Over the past few months, The Fed seemed to all-but-guarantee that rate cuts wouldn’t happen this year. Now, many are calling that a bluff and foresee rate cuts by as soon as this summer.
Translation: Investors believe recent government data and business surveys reasonably justify the Fed will pump the brakes in 2023.
So when the rates go down, things will inevitably go up and to the right?
Well, not really.
In the chart below, the green lines show notable times in which the effective Fed Funds rate started to come down (actual pivot). Each of those times led to fresh, near-term market lows:
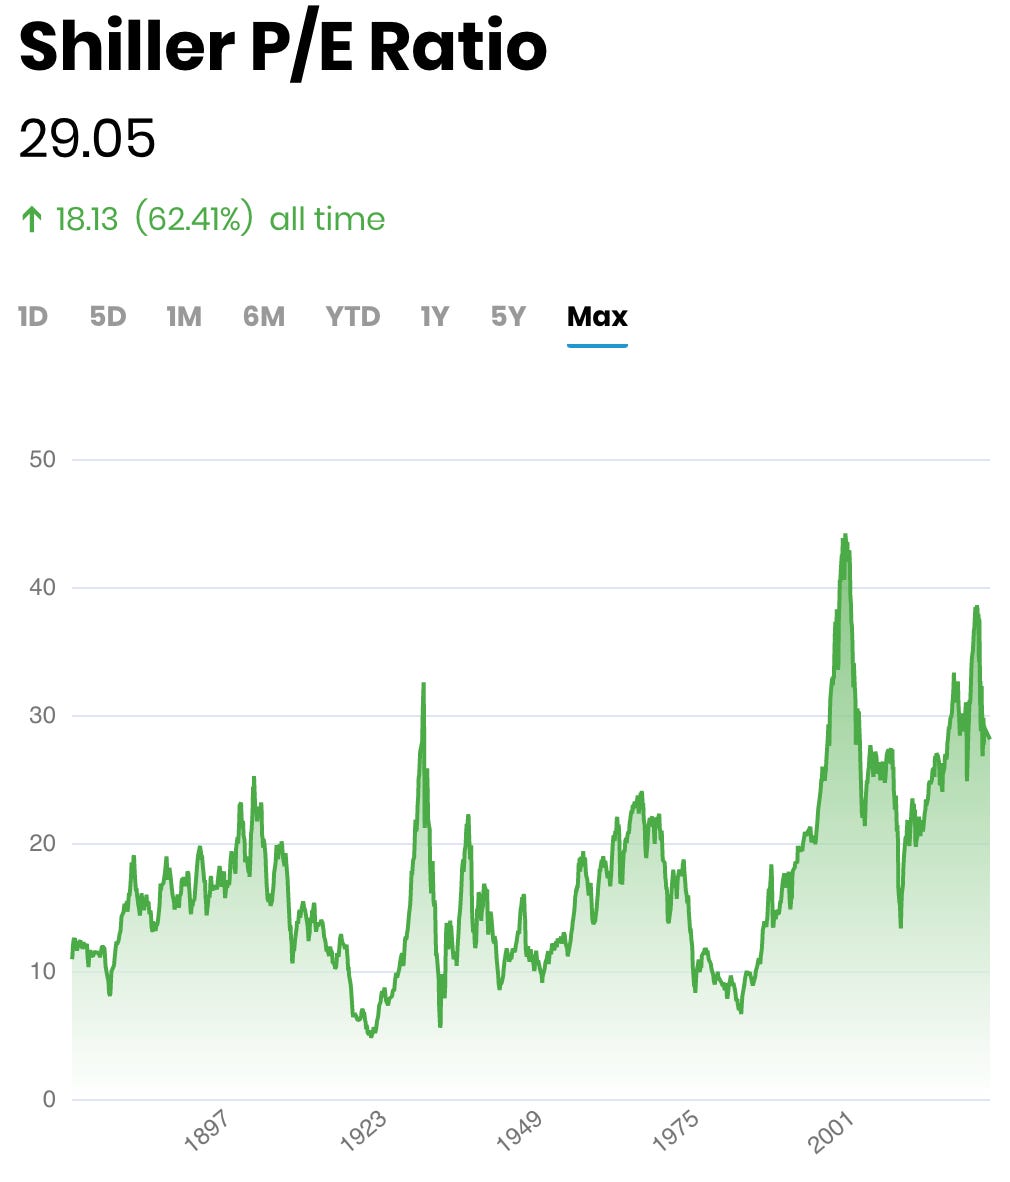
It’s also worth noting that the current Shiller PE ratio is ~29.
The Shiller P/E Ratio is a valuation measure that uses inflation-adjusted earnings per share over a 10-year period to smooth out fluctuations in corporate profits.
Also known as the Price Per Earnings ratio, CAPE Ratio, CAPE, or P/E 10 Ratio.
The average Shiller PE Ratio of the S&P 500 since 1870 is ~17. The median is ~16.
That’s not to say that “everything is overvalued.” Rather — it means this would be one of the “most expensive” starts we’ve ever seen if in fact we’re now back in a bull market. Food for thought.
Worth Noting — the Conference Board’s Leading Economic Indicators (LEI)
See below for a note from Jaguar Analytics, with whom I’ve co-led some Twitter Spaces recently.
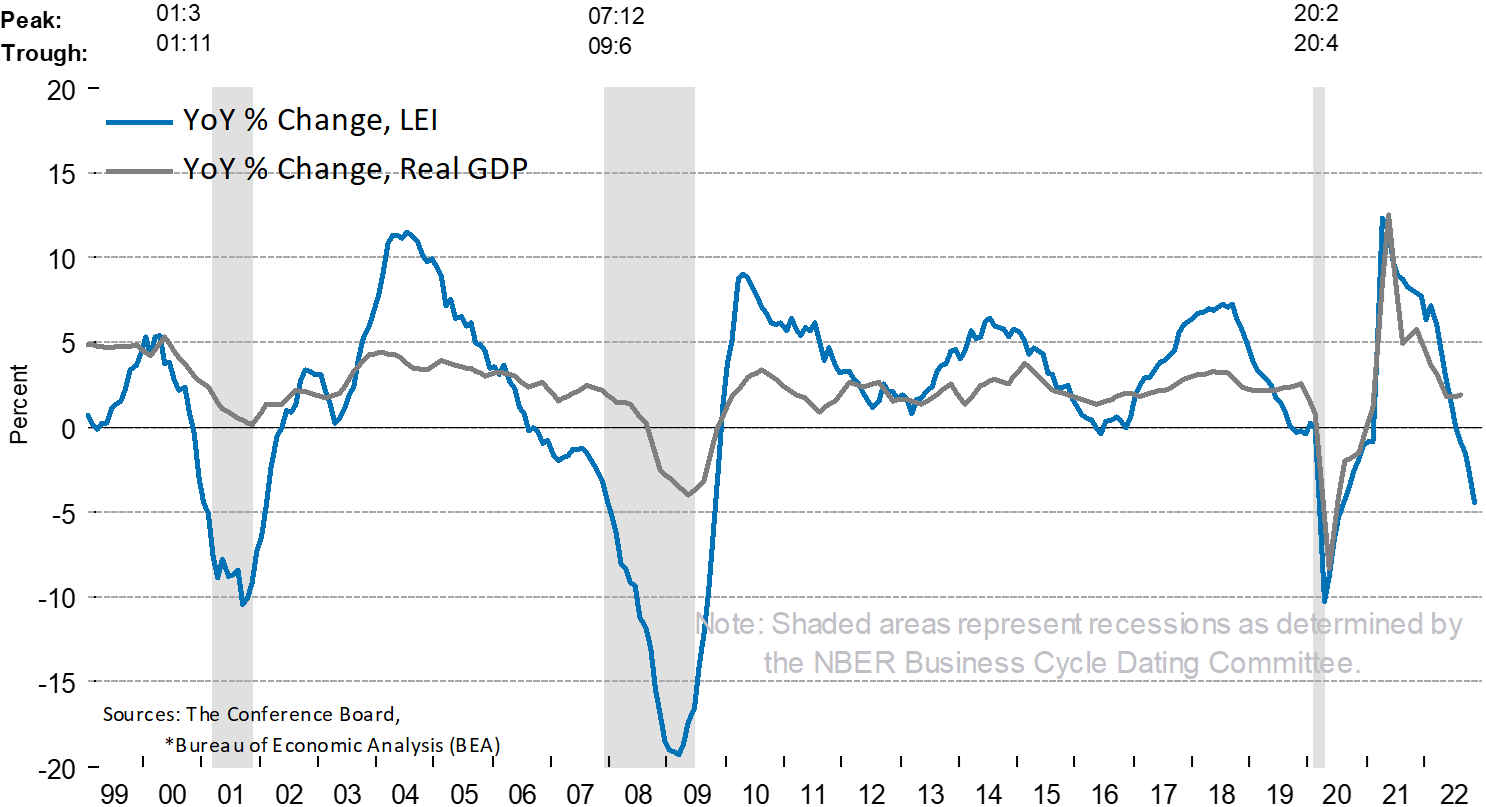
“We started to point out a sharp deterioration in leading economic indicators “rate of change” in summer 2021 and since then we’ve been bearish. 18 months later it still hasn’t improved.
Never in history since 1960, has this indicator posted 6+ consecutive months of m/m decline without the US going into a recession. The last reading marked 9 consecutive monthly decline as shown in chart above.
The GDP deterioration will eventually follow with a lag and currently it is pointing to -2% or worse in coming months, which remains our base case scenario for 1H23. Whether it be a hard or a soft landing will depend on labor market, but there will be a landing of some sort.
The bottom line is that my favorite indicator is giving me a red hot flashing warning which keeps me on sidelines — while everyone is fixated on breakout through 200-day moving average.”
Our General Thesis:
It’s important to remember that the market is very forward-looking.
The graphic above is grossly over-simplified, but the key reason for its inclusion is to highlight that the economy and the stock market rarely trend in perfect tandem.
The stock market has never bottomed with the 10YR / 2YR U.S. Treasury spread being inverted. The market also rarely bottoms before a recession starts. However, we could already be in a (very unique) recession right now — and solely relying on historical trends never leads to the best results.
We believe new lows are ahead, but we aren’t sure when they will arrive.
What does that mean for you? If your plan is to invest into broad market index funds — then it’s reasonable to continue dollar cost averaging throughout 2023. However, I’d encourage you to learn more about beaten down high-quality tech (think Snowflake, Datadog, etc.)
If you are following along with my Portfolio Updates (below) and want to make your money work for you in specific, strategic ways — then it’s reasonable to begin deploying a smaller, more responsible amount of money as we continue to see strength in the markets.
Once things begin to flip more bearish — get more aggressive.
The base case of investors has shifted from a recession to a period of disinflation and below-trend growth (AKA “soft landing”). The danger in the markets right now is that the picture has become much rosier, much quicker than most would have expected.
As always, we’ll be here to update you every step of the way. If you know someone who would also appreciate these updates — consider sharing Rate of Return with them (below).
First, I want to thank the 125 of you who have signed up for Quantbase, and the 66 of you who are investing alongside me in my Dividend Growth strategy — the strategy’s fund just surpassed $110K in assets under management! 🎉
You all have invested over $300K in assets across Quantbase’s different funds — it’s so cool to see you all finding a strategy that suits you and getting after it. For transparency, I’m also investing $100 / month toward their Crisis Flagship fund.
If you want to join the other 100+ folks in our community who are investing either toward my Dividend Growth strategy or other Quantbase funds — read this recent post I shared that breaks it all down.
I’ve attached updated screenshots in the Portfolio Tracker (paying subscribers-only) for you all to review — no material changes this week.
Important Quant Rating Changes:
Salesforce (CRM): 4.70 to 3.42 — this might have something to do with the recent “downgrade” the stock got from an analyst of Wall Street, citing uneven growth in 2023 and 2024.
American Tower Corporation (AMT): 4.78 to 3.33 — we called the original “Hold” to “Strong Buy” in this post, and it seems the rating was short-lived. With that being said, I highly recommend watching this 60-second video about the company.
Balance: $20,117
Week in Review — Too Long, Didn’t Read:
Netflix is forecasting $3B in FCF throughout 2023, Ally Financial is forecasting -$460M in net charge-offs on their retail auto loans, Proctor & Gamble experience a -6% decline in sales volume, the Corporate Bond market is flashing a warning sign, the U.S. Debt Ceiling has been reached, Janet Yellen seems to be buying up bonds, Retail Sales dropped considerably, the Producer Price Index follows suit with inflation being tamed, and the Housing Market Index rose for the first time in over a year.
Key Earnings Announcements:
Netflix is forecasting $3B in FCF during 2023, Ally Financial is forecasting -$460M in net charge-offs on their retail auto loans, and Proctor & Gamble experienced a -6% decline in volume.
Netflix (NFLX)
Key Metrics
Revenue: $7.9 billion, an increase of +2% YoY
Operating Income: $550.0 million, compared to $632.0 million last year
Profits: $55.0 million, compared to $607.0 million last year
Earnings Release Callout
“For 2022, we finished with 231M paid memberships and generated $32B of revenue, $5.6B in operating income, $2.0B of net cash from operating activities and $1.6B of free cash flow (FCF). In 2023, we expect at least $3B of FCF, assuming no material swings in F/X.”
My Takeaway
Much of their Letter to Shareholders was outlining their next few quarters of growth — as well as how they plan to get there.
Here’s the roadmap: revenue, not total number of subscribers, is the new benchmark — they believe as ads and other initiatives drive top-line growth, this line item will become increasingly more important to watch.
1Q23 revenue growth should come in around +4%, driven higher by added subscribers. However, they did warn that as paid ads begin to rollout worldwide they expect folks to cancel their subscriptions — negatively impacting subscriber count. Finally, they outlined an 18-20% operating margin during 2023 — which equates to ~$6.5B in operating income (about +$1B more than 2022).
More importantly, this statement was included in Netflix’s Letter to Shareholders — ”Now that we are a decade into our original programming initiative and have successfully scaled it, we are past the most cash intensive phase of this buildout. As a result, we believe we will now be generating sustained, positive annual free cash flow going forward. Assuming no material swings in F/X, we expect at least $3B of FCF for the full year 2023.”
Here are my thoughts — even if the company delivers on this $3B in FCF.. heck even $4B in FCF during 2023, they’re still trading at 45X price to FCF. No company growing top-line revenue by mid-single digits, experimenting with a new product rollout, and heading into a recession (where more people are likely to be stingy with their subscriptions) should be trading at 45X price to FCF.
I’m not an investor at the current $350 / share price. The stock could rally higher in the near-term, but I think Netflix’s stock is over-valued and should trade back down to the $250 / share range. No position.
Ally Financial (ALLY)
Key Metrics
Revenue: $2.2 billion, an increase of +10% YoY
Profits: $278.0 million, compared to $299.0 million last year
Earnings Release Callout
“In 2022 Ally continued its strategic evolution while navigating a fluid macroeconomic environment. We’re continually assessing the macroeconomic backdrop and remain nimble operators.
Our heightened focus on investment across the enterprise ensures every dollar is aligned with our long-term priorities while our dynamic underwriting across all asset classes allows us to pivot as needed ensuring we maximize risk-adjusted returns and remain well positioned for a variety of environments.”
My Takeaway
As you all might remember from last week’s Week in Review, I’m not the type to hyper-analyze bank stocks — just not something I’m very good at. Instead, I like to dive deeper into their unique perspectives on the current state of the economy — considering all of their first-party data.
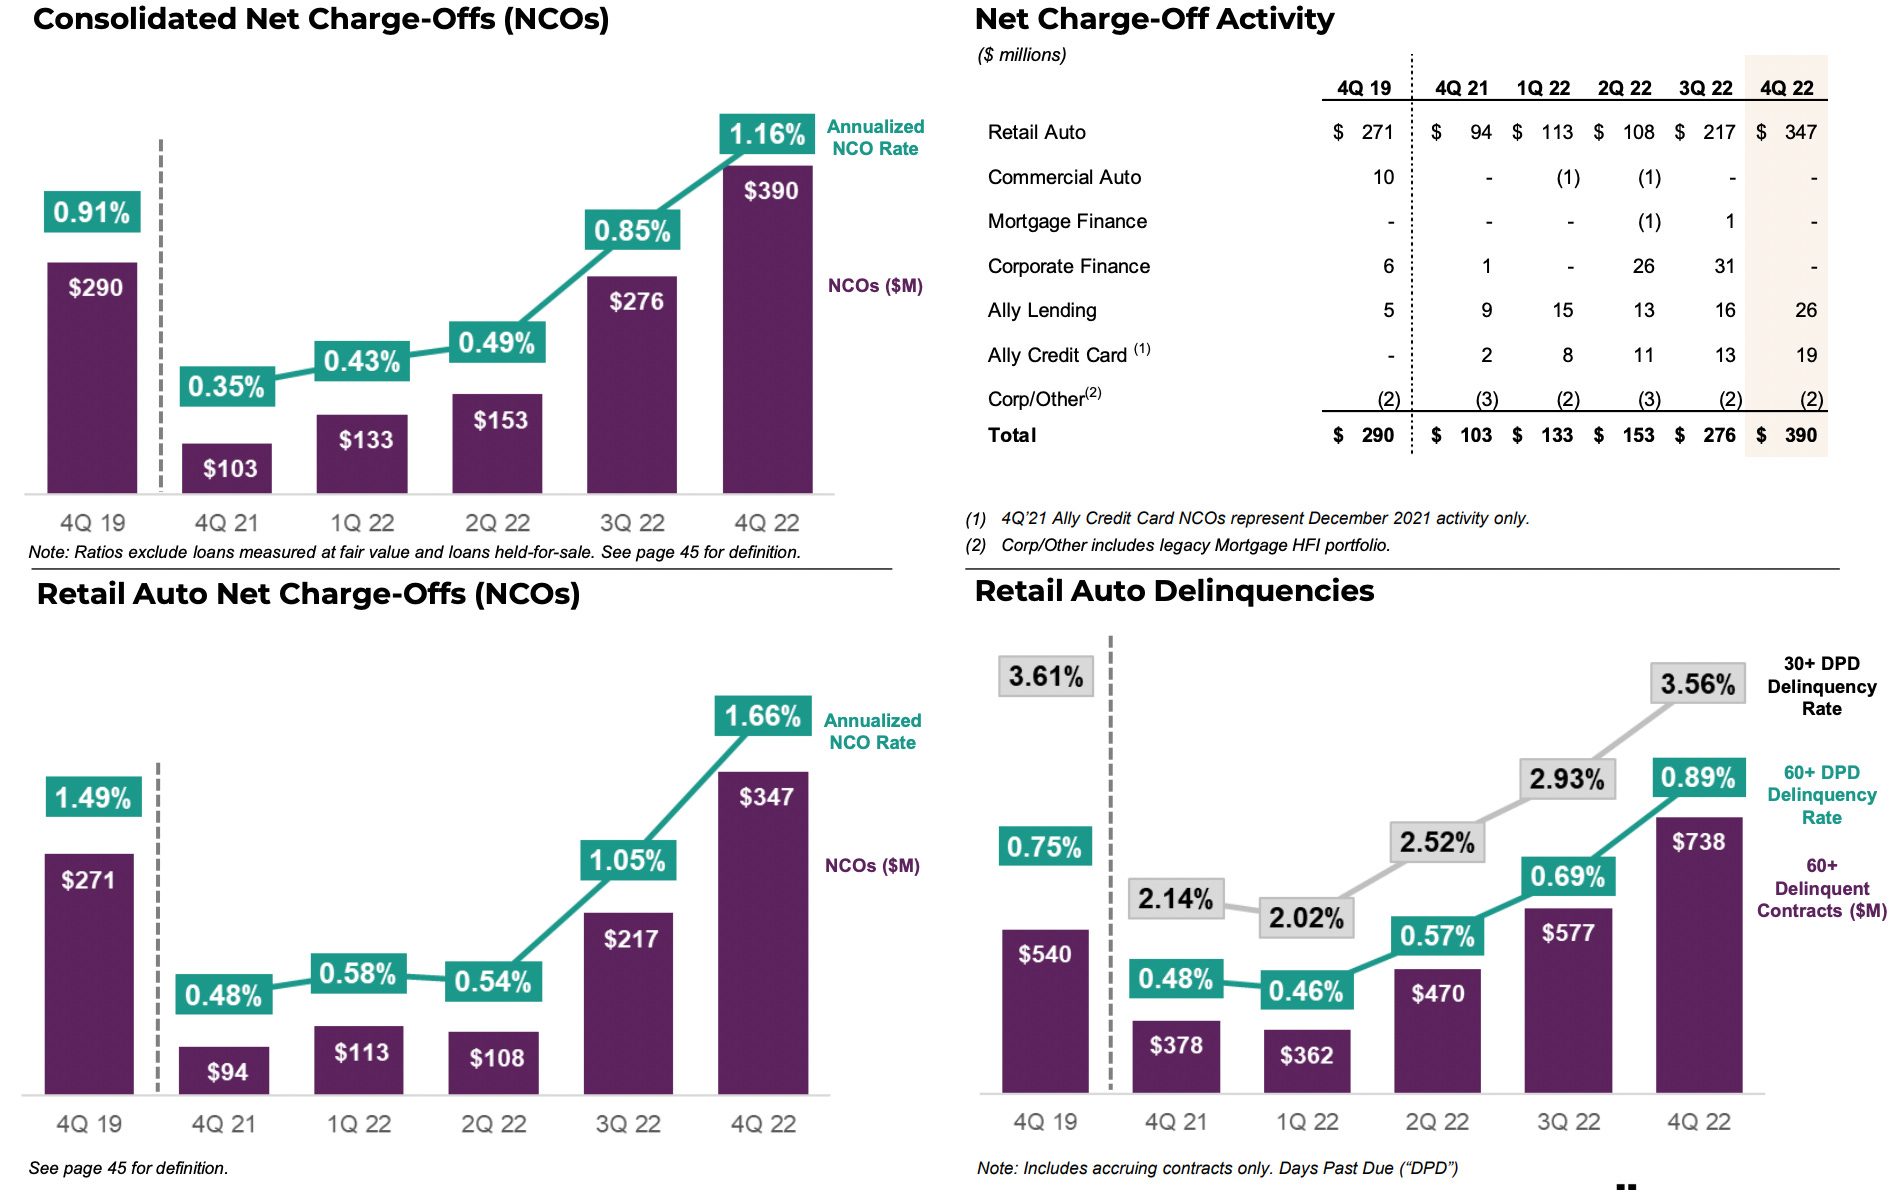
I think the slide below paints the picture very well —
Ally Financial, like the other banks we covered last week, is experiencing heightening delinquencies and net charge-offs (bad debt from their consumers). All of the graphs above depict net charge-offs and delinquency rates higher than Q4 of 2019 — before the pandemic took place.
Ally Financial has stashed away $3.7B in reserves to ensure their business will be able to continue operations in case customers stop paying back their loans — this $3.7B figure increased +$400M during 2022 alone.
Slide 25 of their presentation forecasts retail auto net charge-offs to increase from 1.66% in Q4 2022 to 2.2% in Q4 2023 — as well as a mild recession.
Hold on to your hats — 2023 is going to be a bumpy ride. No position.
Procter & Gamble (PG)
Key Metrics
Revenue: $20.8 billion, compared to $21.0 billion last year
Operating Income: $4.9 billion, compared to $5.2 billion last year
Profits: $4.0 billion, compared to $4.2 billion last year
Earnings Call Callout
“The -6% volume decline on the quarter… is not really consumption driven. One point came from cutting -50% of our portfolio in Russia, two points came from temporary inventory reduction in China given their COVID lockdowns. If you strip that out, the actual consumption-related volume decline was about -3% on the quarter.”
My Takeaway
Well, inflation is certainly upon us. A -6% decline in sales volume translating into only a -1% decline in sales means PG is certainly raising prices on their products.
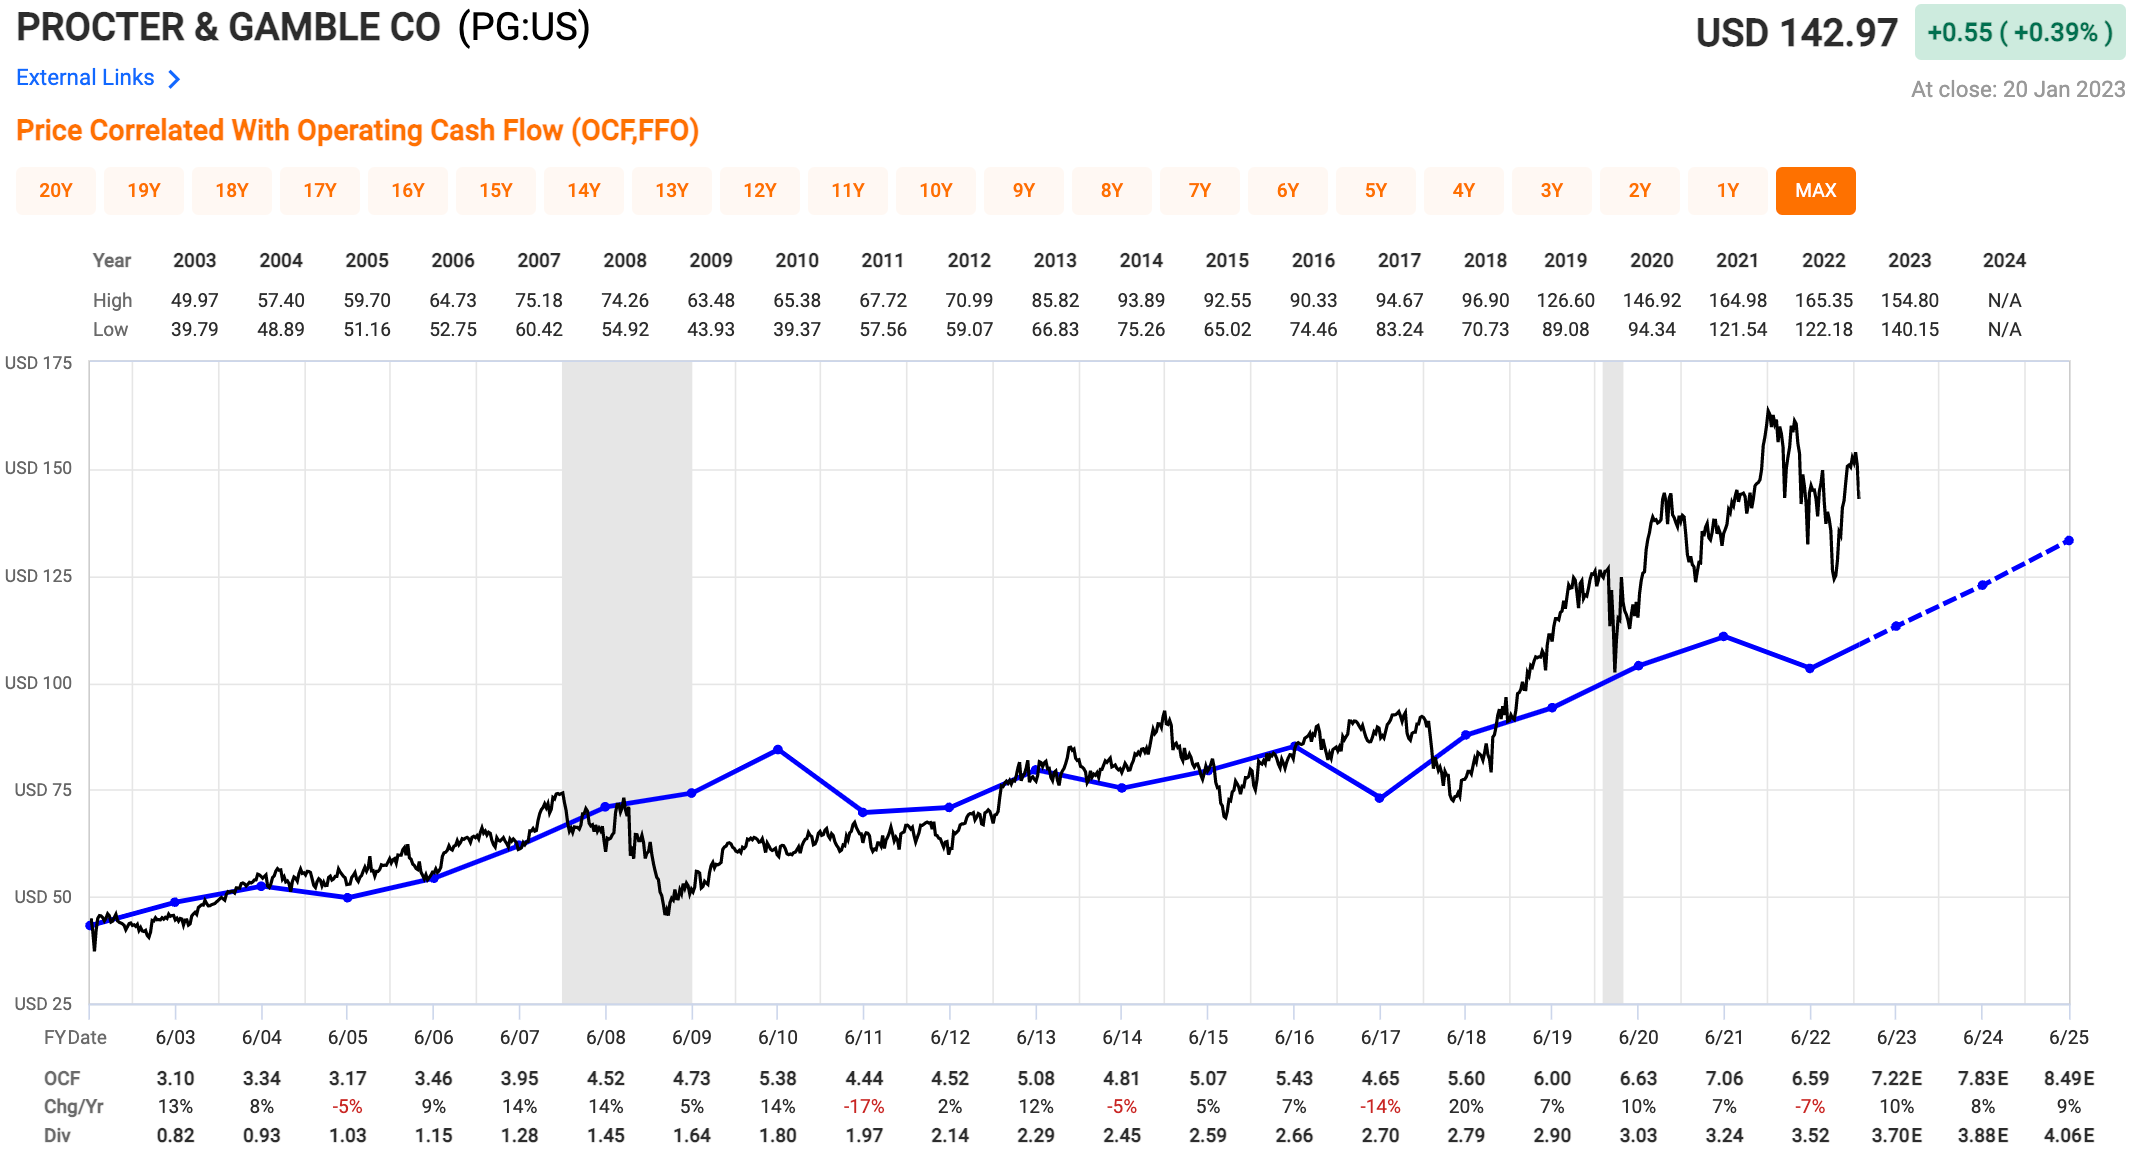
Here’s my take — despite Proctor & Gamble being a dividend aristocrat having paid and raised their dividend every year for 66 consecutive years, the stock seems overvalued at the moment.
The blue line is operating cash flow and the black line is their stock price. It doesn’t take a rocket scientist to observe the clear correlation between the two — and the lack thereof over the last ~18 months as investors “flew to safety” while the market crashed in 2022.
PG is trading at some 26X forward FCF with negative-to-flat revenue guidance, and alluded to flat earnings growth in 2023. Sure, they’ll return $15-17B to their shareholders in 2023 in the form of dividend and share repurchases — but 2023 remains a year of headwinds and challenges for PG.
No position.
Investor Events / Global Affairs:
Correlation between the bond market and the stock market, we’re officially hit the US government debt ceiling, and Janet Yellen is betting on a soft landing.
Bonds, James Bonds.
As made clear by the incredible work of The Macro Compass — a less volatile bond market generally makes the S&P 500 go up. In the chart above, the performance of the S&P is inverted to showed the strong correlation.
This is one of the reasons why the market has started out the year so strong — the bond market is more stable (albeit not thriving, but still more stable).
The U.S. bond market is made up of U.S. Treasury bonds (mentioned above by Macro Compass), other U.S. government bonds, municipal bonds, and what’s shown in the chart above — corporate bonds.
An incredible amount of corporate bonds are set to mature next year (chart above).
To an extent, the Fed’s rate-raising actions experience a lag until companies need to either raise new debt at higher rates or refinance their existing debt.
We’re interested to see if this colossal percentage of corporate bonds maturing will lead to increased volatility in the U.S. bond market as whole — and how that might impact the S&P 500.
U.S. Debt Ceiling Reached
On Thursday, Treasury Secretary Janet Yellen wrote to Congress that the U.S. has reached its debt limit. In simple terms, the debt ceiling is the maximum amount of money the government can borrow.
It’s been raised 45 times in the last 40 years.
This will now be a political battle for all of 1H’23. Republicans will try to keep the limit from being raised higher, but they will eventually concede. The need of the debt ceiling being raised is often used as a bargaining chip to get other things passed in Washington — as all of the politicians know the government will not default on its debt.
The raises to the U.S. debt limit over the last two decades paint a depressing picture:
Source: PBS
What the Experts Are Saying:
Source: NPR
“As in the past, attempts to gain political advantage by holding the debt ceiling hostage amount to a juvenile game of chicken and both parties deserve the scorn of voters for not eliminating this fiscal doomsday machine years ago.
Moreover, debt ceiling theater has always acted as an easy distraction for those who minds ought be focused on managing the federal budget in a responsible way.
“We’ve seen this movie before. Because we’ve had a series of debt limit fights that ultimately get solved, US investors are reluctant to overreact to the risk of failure.
Right now, I’m not so sure that global investors are quite so sanguine. International markets are outperforming the US. It is quite possible that those who can allocate capital globally are moving money out of the US ahead of this potential stalemate.” —Steve Sosnick, Chief Strategist at Interactive Brokers
Yellen’s Sneaky Moves
Last year, we hypothesized that Janet Yellen would buy back Treasury bonds at a high rate — effectively conducting backdoor Quantitative Easing (QE) while the Fed conducts Quantitative Tightening (QT).
“QT has been almost entirely offset by Janet Yellen running down the Treasury savings account. By the way, pretty amazing policy [sarcasm]. She could have sold ten years for under 1 percent during this time. Instead, she runs down the Treasury savings account.
So all of that has mass liquidity shrinkage, but it really comes into full gear, and she can continue this for a while. We can do the SPR for a while, stimulative stuff. But by the first quarter of ’23, it kind of goes the other way. So our base case is a hard landing by the end of ’23.”
And then see what was said Bloomberg just yesterday:
“But now with the debt-ceiling looming, the Treasury is set to shrink its pile of cash and adjust its stock of bills to prolong its borrowing authority. That will likely keep markets relatively more flush with cash, thwarting the Fed’s efforts to drain liquidity from the system at least until an agreement is reached.”
The Fed wants to unload its balance sheet, crush inflation, and stick to its plan. Yellen and the Treasury want to raise the debt ceiling and provide market stability while the Fed is trying to achieve its goal.
They want to stabilize the bond market (and consequently the stock market) as much as possible, all while letting Jerome Powell & Co. keep their promises.
Janet Yellen can’t drain the Treasury savings account forever, but we’ll see if her and Jerome Powell are timing all of this perfectly. Can they truly execute a soft landing? It looks like they’re betting on it.
Major Economic Events:
Retail Sales didn’t get a holiday bump, the PPI dropped dramatically, and a two-sided Housing Market update.
Retail Sales
Source: The Observatory
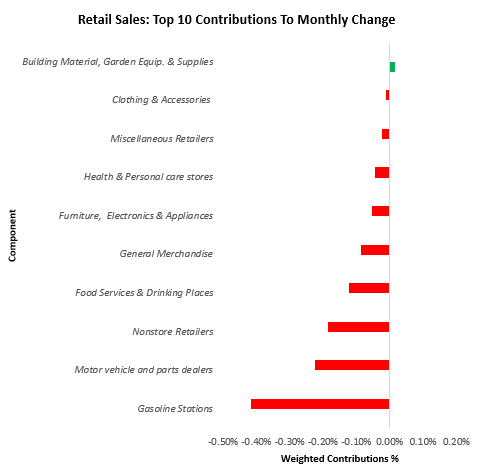
Retail spending fell in December at the sharpest pace of 2022 — surprising many economists that were expecting a holiday shopping boost. Purchases at restaurants, stores, and online vendors dropped -1.1% month-over-month.
Retail Sales Monthly Change Contributors:
Source: The Observatory
“The lag impact of elevated inflation weighs heavily on U.S. households, it’s very clear that the median American consumer is still reeling from the loss of wages in inflation-adjusted terms… we’re moving towards what I would expect to be a mild recession in 2023.” — Joseph Brusuelas, chief economist at RSM US LLP
Producer Price Index
The Producer Price Index (PPI) — or “Inflation for Producers” — dropped by the highest degree since the start of the pandemic. Falling -0.5% last month, the PPI has officially started to follow suit with the CPI’s noteworthy decreases.
More Fuel for the Fed to Pivot:
As mentioned earlier in this post, the Fed is succeeding in bringing down inflation for both consumers and producers — but keep an eye on the unemployment rate in red. If it begins to materially rise — while inflation metrics continue to improve — then the seemingly new consensus argument that the Fed will cut rates this summer becomes all the more likely.
Housing Market Index
The National Association of Home Builders (NAHB) Housing Market Index increased to 35 in January 2023, from 31 in December 2022. This marked the first rise in the index since December of 2021 — beating expectations by +4 points.
"It appears the low point for builder sentiment in this cycle was registered in December, even as many builders continue to use a variety of incentives, including price reductions, to bolster sales.
The rise in builder sentiment also means that cycle lows for permits and starts are likely near, and a rebound for home building could be underway later in 2023" — Jerry Konter, NAHB Chairman
KB Homes (KBH), a massive home builder, recently reported a 68% cancellation rate. That means that over two-thirds of their homebuyers walked away from their contracts in Q4’22. Compare this to the Q4’21 cancel rate of just 13%.
This type of cancellation rate is even worse than what most home builder companies experienced in 2008. For example, DR Horton’s (DHI) cancellation rate peaked at ~50% after the 2008 crash.
This can result in a pile-up of housing inventory, and can change the housing market landscape at a rapid pace.
It’s interesting to see the contrast between the NAHB Chairman’s positive outlook above, and the cancelled contracts anecdote. We’ll see how much of a lag there truly is in the earnings of home builder stocks and have more clarity as the year goes on.
If you’re starting your investing journey or want to change to a cleaner, social-focused investing platform, consider visiting Public.com.
Disclaimer: This is not financial advice or recommendation for any investment. The content is for informational purposes only, you should not construe any such information or other material as legal, tax, investment, financial, or other advice.