We can’t believe we’re already approaching the end of Q1.
Q4 earnings have largely been reported for the ~50 positions in the Dividend Growth Portfolio — and as always, we’re going to give you their most important takeaways and our thoughts.
Before we jump into the analysis, a quick reminder to listen to the Rich Habits Podcast — co-hosted by Robert Croak and myself.
Robert founded Sillybandz in 2006, and has since grown the company to $100M in annual sales. He has a net worth of $15M+ and recently started sharing his hot takes on business, finance, and mindset on TikTok and Instagram.
If you’re someone in your 20s, 30s, or even 40s looking for tactical ideas on how to start a business, generate more income, effectively leverage debt to build wealth, and everything in between — we encourage you to listen!
Robert is in his 50s and has it all “figured out.” I’m in my 20s and am still “figuring it all out.” Together, we’re able to bring two unique perspectives on building wealth in today’s environment.
I also want to quickly apologize — this week’s “Week in Review” is going to be a bit on the shorter side. My co-writer, Christian Blackwell, is under the weather and unable to provide us with his incredible macro / global affairs analysis.
If we rewind the clocks back December or so (when I began researching companies I wanted to include in my Dividend Growth Portfolio) I came across 3M (MMM) as a potential holding.
The company was a dividend king, had the ability to growth their operating income by a few percentage points in 2023 / 2024, as well as paid a relatively high dividend yield.
Since opening a position, the company has had trouble navigating a terrible lawsuit pertaining to hearing loss — causing their stock price to crash further.
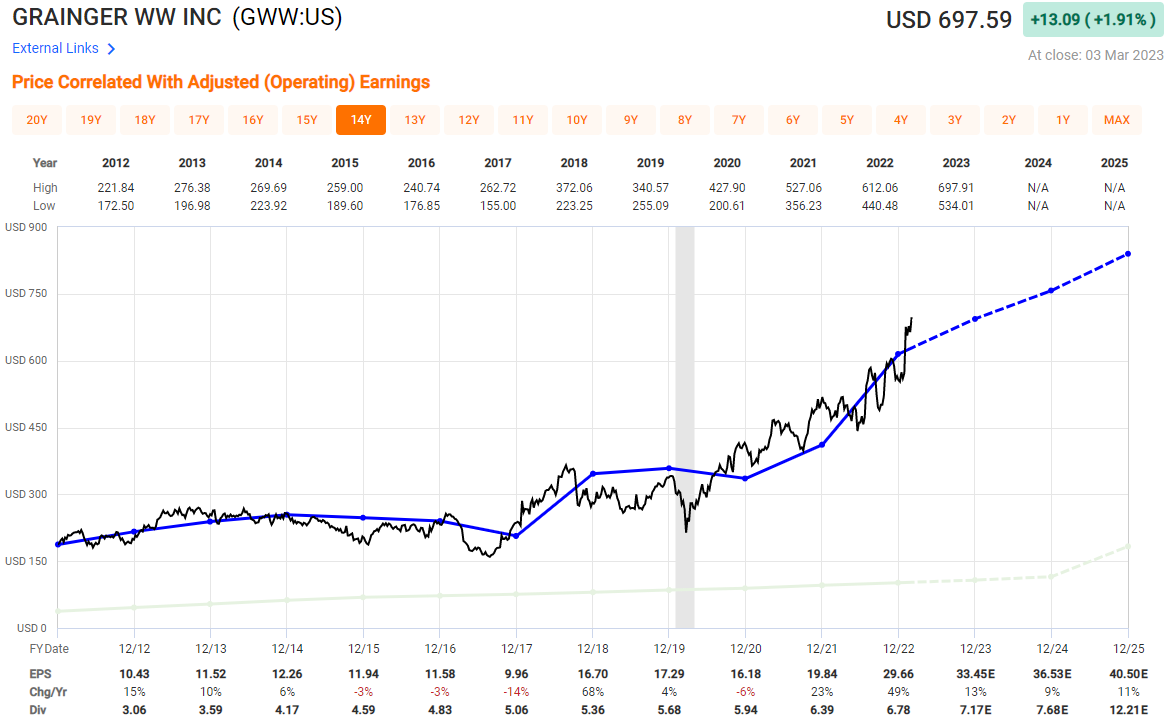
Late last-week I sold my position in 3M and replaced it with W.W. Grainger (GWW). The company is similar to 3M as they also distribute maintenance, repair, and operating products — however, they’re positioned to grow much more aggressively from an EPS perspective, and don’t have any lawsuit overhangs.
It’s pretty obvious their stock price (black line) follows their EPS (blue line) — and we can see clear as day where that blue line is headed.
I also plan to close the “healthcare” leaning positions in the portfolio and instead move that ~$1,000 or so into (SCHD) — primarily because of the timeline of this Dividend Growth Portfolio.
If you zoom out and look at the yield on cost of SCHD ten years ago vs. today — it’s jaw dropping.
Considering this $2M portfolio is a 10-year journey, nothing excites me more than knowing every dollar (on average) I’m able to invest toward this ETF will eventually yield me 10% annually — assuming reinvestment of dividends.
Important Quant Rating Changes:
Lowe’s (LOW): 4.89 to 3.20 — you all might remember from this post Lowe’s Quant Rating jumping from “Hold” to “Strong Buy,” well that was short-lived.
Realty Income Corporation (O): 3.76 to 4.69 — this company has been flipping back and forth between “Buy” and “Strong Buy.” I remain bullish.
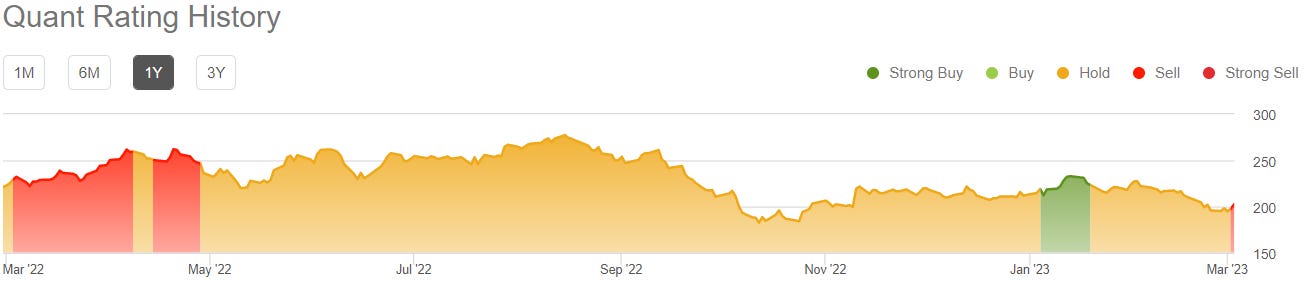
American Tower Corporation (AMT): 3.00 to 1.85 — well, a company I’m generally bullish on just flipped from “Hold” to “Sell” on Seeking Alpha’s Quant Rating. If you zoom out, this has happened twice before without much negative volatility. I’ll remain a shareholder.
Google (GOOGL): 4.52 to 3.35 — a company we’ve been bullish on for a while now, as one of the larger holdings in the portfolio, just flipped from “Strong Buy” to “Hold.” This doesn’t change my thesis, and will not catalyze any sort of position change for me.
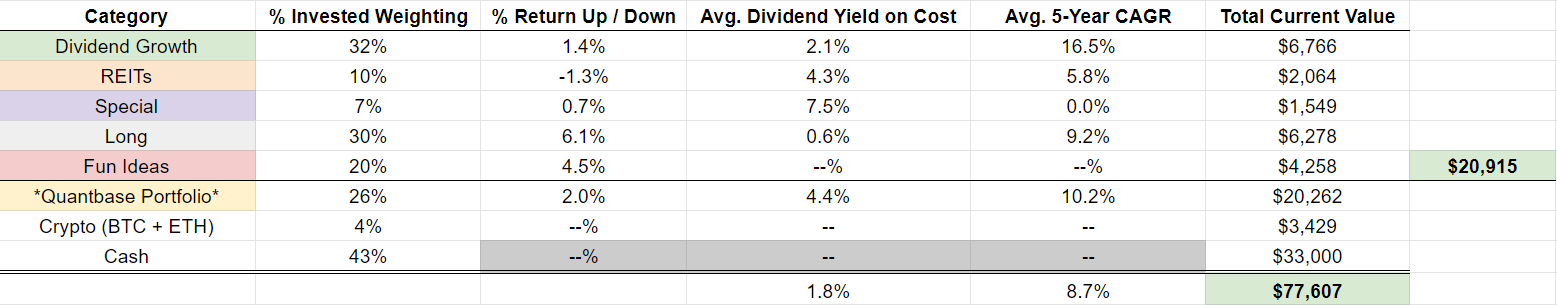
Balance: $77,607 — which means we’re 3.9% of the way to our $2M goal!
Week in Review — Too Long, Didn’t Read:
Target is now a turnaround story, Lowe’s returned $16.5B to their shareholders in 2022, record operating cash flow coming from Salesforce, Snowflake is on track to generate $10B in revenue, and Broadcom raised their dividend by +12%.
Key Earnings Announcements:
Target, Lowe’s, Salesforce, Snowflake, and Broadcom.
Target (TGT)
Key Metrics
Revenue: $31.0 billion, an increase of +1.2% YoY
Operating Income: $1.2 billion, compared to $2.1 billion last year
Profits: $876.0 million, compared to $1.5 billion last year
Earnings Release Callout
“Strength in Food & Beverage, Beauty and Household Essentials offset ongoing softness in discretionary categories. This performance highlights the benefit of our multi-category merchandise assortment, which drives relevance with our guests in any environment, and is a key reason we grew traffic every quarter last year.”
My Takeaway
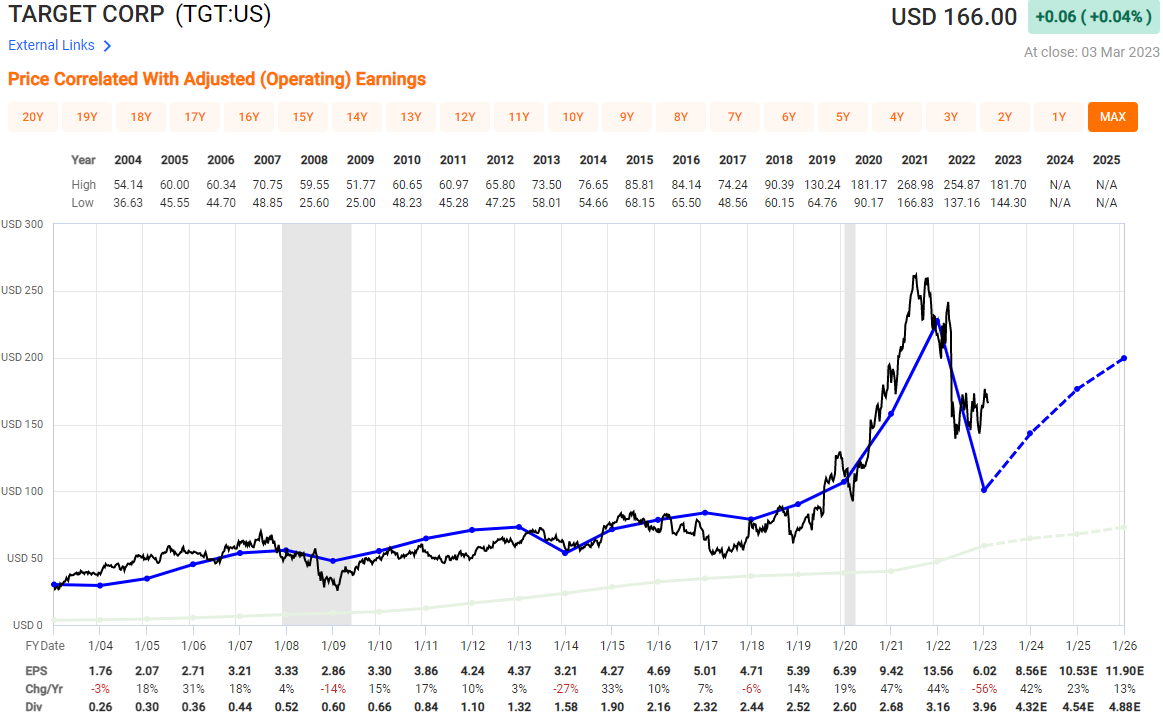
I knew Target was going through it in 2021 and 2022 with their inventory problems, inflation, rising wages, etc. but I didn’t know it was this bad.
The company’s profits fell -60% in 2022 when compared to 2021 — $2.8B vs. $6.9B, and it’s made painfully obvious by looking at the chart above.
However, the bulls on Wall Street are excited about 2024 and 2025 for Target, and here’s why:
Capital Expenditures of $5B — Target is planning to spend $4-5B in 2023 on 175 store remodels, 20 new stores, digital experiences surrounding their Circle loyalty service, and supply chain projects i.e. sortation centers that should scale to 15+ by 2026.
Margin expansion — Target’s management team is confident in their ability to recapture not only the temporary pressures faced in 2022 (think inventory and freight), but also opportunities to realize additional savings of $2-3B via more efficiencies across the business.
Wall Street is modeling for Target to recover $6B+ in gross profit margin by 2025 — which could mean they’ll double their poor 2022 earnings by 2026 (the graph above does a good job illustrating that).
Personally, I think there are better places to park money — Target is spending a lot to try and “keep up their stores” as well as continue to attract new and existing customers. Their gross profit margin compressed nearly -5% year-over-year, and we likely won’t see it recover to previous highs until 2026 / 2027.
No position.
Lowe’s (LOW)
Key Metrics
Revenue: $22.5 billion, an increase of +5.1% YoY
Operating Income: $1.7 billion, compared to $1.8 billion last year
Profits: $957.0 million, compared to $1.2 billion last year
Earnings Release Callout
“I am confident we are making the right investments – in our associates and in our business – to drive long-term growth. We also continue to improve operating margin, demonstrating our ongoing focus on driving productivity across the company.”
My Takeaway
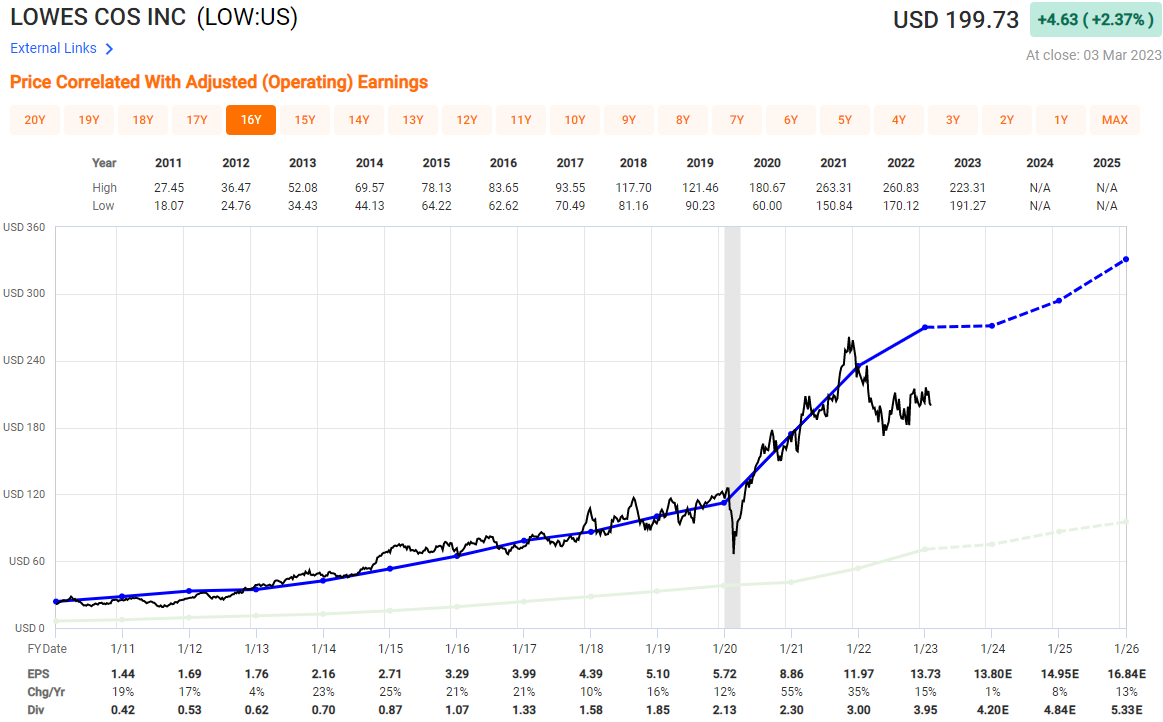
There are a few things to consider here — 2023 demand, current (depressed) valuation, and their return of capital to shareholders.
2023 demand — home improvement is likely to continue to decline this year, as a main catalyst for this activity is “selling your house.” We’re now in the 12th consecutive month of declining existing home sales in the US.
Current (depressed) valuation — the company’s stock is trading at ~14X forward earnings per share, much lower than their ~17X three-year-average, and their ~20X 15-year average (shown below). Assuming the stock is able to recover back up to this ~18X range by the end of 2025, we could expect a $305 / share stock price (+59% total return / +17% annual return).
Returning capital to shareholders — Lowe’s returned $14.1 billion in capital to shareholders in the form of share repurchases, as well as $2.4 billion in the form of dividends throughout 2022. That’s $16.5 billion returned to shareholders last year alone — and I’m one of them!
The company is clearly well-capitalized to continue paying and raising their dividend — the main reason I’m a shareholder. However, now that I see just how “undervalued” this stock might be (historically speaking) I’ll likely raise my position slightly above the current ~3% weighting throughout 2023.
Salesforce (CRM)
Key Metrics
Revenue: $8.4 billion, an increase of +14% YoY
Operating Income: $357.0 million, compared to a -$176.0 million loss last year
Net Loss: -$98.0 million, compared to a -$28.0 million loss last year
Earnings Release Callout
“We closed FY23 with operating cash flow reaching $7.1 billion, up 19% year-over-year, the highest cash flow in our company’s history, and one of the highest cash flows of any enterprise software company our size.”
My Takeaway
Show me that operating cash flow, baby!
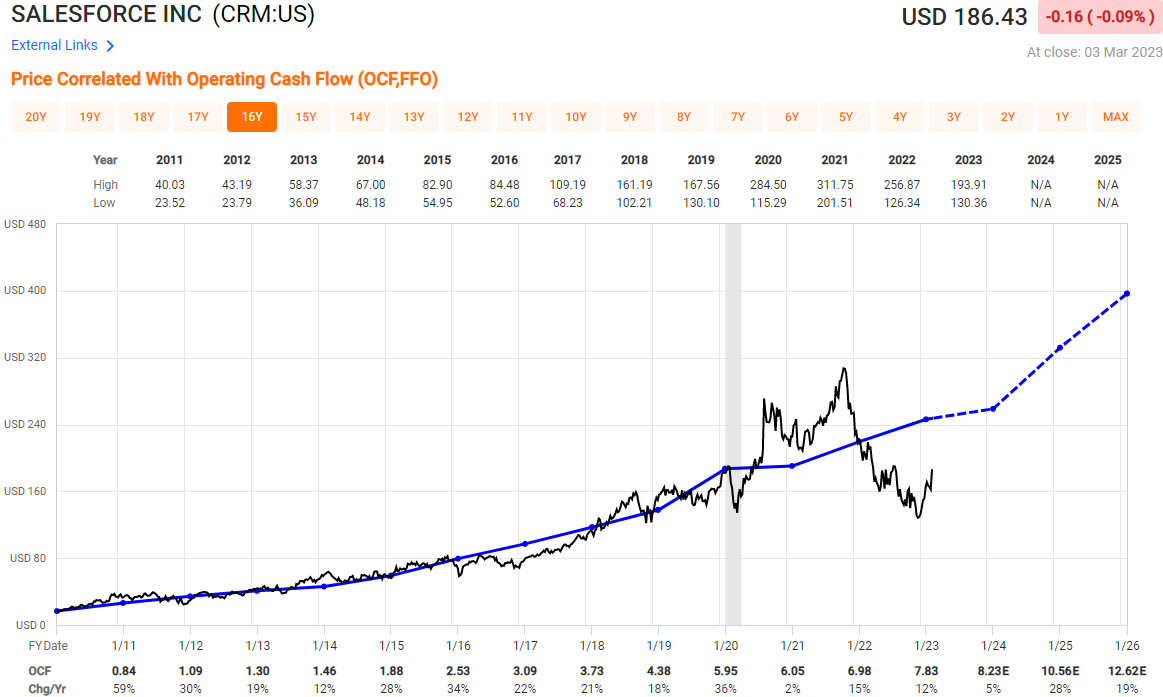
As you all might recall, Salesforce has been a position in the “Long” section of the portfolio (accompanied by Google, Amazon, Apple, and others) for a few months now — mainly because of our conviction around operating cash flow growth.
Well, that conviction served true — the company grew their operating cash flow by +19% in 2022, and are on track to add another +17% in 2023.
Check out this graph of Salesforce stock between 2010 and 2020 (post-recession and pre-pandemic.. normal years) — the stock (black line) moved in tandem with operating cash flow (blue line).
Now if we fast forward to today + include Wall Street’s forward-looking forecasts, operating cash flow is clearly projected to grow.. which I imagine would take their stock price with it.
There are a ton of reasons why I remain excited about this company — their remaining performance obligations (RPO) came in at $24.6B, record-low customer attrition, strength in multi-cloud deals with their top 10 wins during the quarter all consisting of 5+ clouds, as well as a strong guidance for the year.
I remain a bullish shareholder (~3% of portfolio).