Goodness gracious — do we have some things to talk about.
Source: Charles Schwab
First off — we’re right on track for a recession.
We’re most likely already in one. It’s difficult for it to be an official recession because the labor market remains strong, but EPS growth is falling and the ISM Manufacturing Index has remained below 50 for three consecutive readings now.
However — the markets are forward-looking:
Source: JPMorgan
The markets are acting as if companies will have one or two more below-trend earnings reports, and then things will be back to normal.
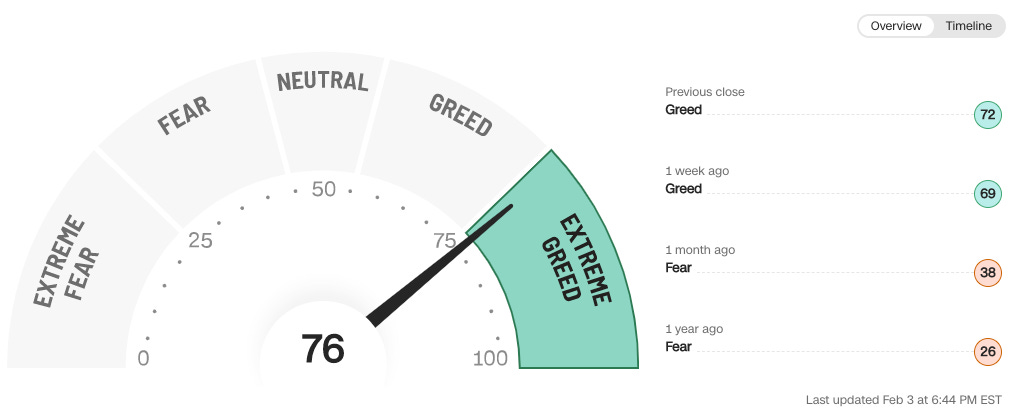
Not to mention… greed is in the air:
Source: CNN
The chart above shows the number of stocks on the NYSE at 52-week highs compared to those at 52-week lows. When there are many more highs than lows, that’s a tell-tale signal for greed.
In this case, it shows that a bear market rally has been largely successful in helping beaten-down stocks recover.
And all of this is taking place while sales growth of S&P 500 companies (above) continues to shift in the wrong direction.
Our job is to determine if the dominos will continue to fall, and for how long they may remain ‘knocked over’ once they do.
Portfolio Updates:
I have a few big updates for you!
First, I’ve added a few more columns inside of the tabs in the Portfolio Tracker — specifically, “number of shares,” and “value.” This way, you’ll more easily be able to see exactly how much I have invested into a specific name.
Next, on the “Performance” tab — I’ve added the value of my “Fun Ideas.” These include the names mentioned in this post.
Next, I’ve deployed another $10,000 toward my Quantbase portfolio. Here's a screenshot of my dashboard that shows the additional buying power — I’ll dollar cost average $2,500 / week into the Dividend Growth Strategy throughout February.
If you’d like to join the other 130+ folks investing alongside me toward a strategy that has outperformed the market by +100% over the last decade — click here.
Finally, I’ll be deploying another +$35K toward my Portfolio Tracker names. The cash is currently being transferred to my brokerage account and I should have it deployed in the same names shared in the Portfolio Tracker by the end of this week.
You’ll see the value of every name in the Portfolio Tracker increase by 3X or so — no new names, no new weightings or strategies, just more money into the companies we believe in.
We’re now hovering around $20K, but after the $10K is deployed into the Dividend Growth Strategy and another $35K into the names shown in the Portfolio Tracker — we’ll be hovering around $65K in value.
We’re 3.3% of the way to reaching our decade-long $2M portfolio goal!
Week in Review — Too Long, Didn’t Read:
Meta reclaims a positive FCF story, Humana continues to inch toward $37 in EPS, Amazon AWS leaves us on our heels, Google continues to print FCF for their investors, China’s surveillance balloon makes it across the entire country before being shot down, retail traders have been flooding the market, Microsoft moves quickly to implement ChatGPT, the FOMC is expected to raise rates at least two more times, the Manufacturing sector is in a bad spot, the Unemployment Rate is in an unbelievable spot, and the National Debt passed $31.5 trillion.
Key Earnings Announcements:
Meta reclaims a positive FCF story, Humana continues to inch toward $37 in EPS, Amazon AWS leaves us on our heels, and Google continues to print FCF for their investors.
Meta (META)
Key Metrics
Revenue: $32.2 billion, compared to $33.7 billion last year
Operating Income: $6.4 billion, compared to $12.6 billion last year
Profits: $4.7 billion, compared to $10.3 billion last year
Earnings Call Callout
“Turning now to the expense outlook, we anticipate our full year 2023 total expenses will be in the range of $89 billion to $95 billion, lower from our prior outlook of $94 billion to $100 billion due to slower anticipated growth in payroll expenses and cost of revenue. We expect capital expenditures to be in the range of $30 billion to $33 billion, lowered from our prior estimate of $34 billion to $37 billion.”
My Takeaway
There are a ton of reasons to be excited about this company — especially after this report. Mark Zuckerberg shared with us his theme of “operational efficiency” for 2023.
This is in-part why their stock rallied after the report was released — having announced their intention to save some $10B+ in expenses throughout the year.
Growing ecosystem — Meta’s “Family of Apps” grew to 2.96 billion daily active users, and 3.74 billion monthly active users. Facebook’s DAU hit 2 billion for the first time ever in December, catalyzed by the quick adoption of Reels across both Instagram and Facebook. Reels plays have more than doubled over the last 12 months.
Sustained advertiser revenue — Meta’s “Family of Apps” generated $31.3 billion in advertiser revenue throughout the quarter, up +2% YoY and much higher than what most analysts feared.
Operational efficiency — Susan Li shared with us an update on the strides Meta is taking to increase operational efficiencies, including: growing revenue by offering more ad supply solutions for their business users, and decreasing expenses by focusing spend instead on new data centers for AI use.
The last time we spoke about Meta (post linked here), we encouraged you all to wait to on the sidelines to see what 2023 would bring for the company — in our opinion there was too much uncertainty with their $100B expense outlook.
Now, I can confidently say there are plenty of reasons to be excited about Meta’s business in 2024 and beyond. Given the updated expense and CapEx guidance they provided, their free cash flow story looks much better (not flat).
Humana (HUM)
Key Metrics
Revenue: $22.4 billion, an increase of +7% YoY
Net Loss: -$71.0 million, compared to -$60.0 million last year.
Earnings Release Callout
“Humana is pleased to start the year in a position of strength, with robust 2023 individual Medicare Advantage (MA) membership growth expected to be at least 625,000 for the year, a year-over-year increase of 13.7 percent.
This robust membership outlook reflects high quality growth, with our improvement in retention more than doubling expectations, and marks a continuation of our strong track record of membership growth, with our compounded annual growth from 2018 to 2022 at 10.4 percent as compared to industry growth of 9.7 percent.
Humana significantly advanced its strategy in 2022 for continued leadership in integrated value-based care, while delivering 22 percent Adjusted EPS growth. Looking ahead, we are confident in achieving our 2025 Adjusted EPS commitment of $37.”
My Takeaway
Humana is a no-brainer dividend growth position for me.
As someone who has worked in healthcare for years out of college — I understand first-hand as to how important their business is to tens of millions of seniors around the country. I also understand the growth and efficiency levers they’re pulling in 2023 and beyond to increase margins and scalability.
As stated above, the company entered 2023 from a position of strength — they closed out 2022 with 70% of their individual Medicare Advantage members engaged in value-based arrangements. This means if Humana’s ecosystem of preventative care initiatives continue to work — the healthier they keep people, the more money they’ll make.
Another exciting data point they shared with us is that the growth they’ve seen in value-based patient arrangements is taking place in states that already have high value-based penetration from competitors. This means Humana is taking market share away from their competitors — specifically in Texas, Georgia, Florida, and Illinois.
Humana guided to $28 in earnings-per-share for 2023 — a +11% increase year-over-year. This EPS guidance assumes ~$103B in annualized revenue in 2023 driven by growth in their Medicare Advantage, Medicaid, and CenterWell businesses.
They also plan to add +1M more patients to their value-based care arrangements — positioning them for continued financial success beyond 2023.
The company’s earnings per share has clearly trended up and to the right throughout the years — and will continue to do so for the foreseeable future. I’m a shareholder and will continue to expand upon my position through dollar-cost averaging.
Amazon (AMZN)
Key Metrics
Revenue: $149.2 billion, an increase of +12% YoY
Operating Income: $2.7 billion, compared to only $3.5 billion last year
Profits: $278.0 million, compared to $14.9 billion last year
Earnings Release Callout
“In the short term, we face an uncertain economy, but we remain quite optimistic about the long-term opportunities for Amazon.
The vast majority of total market segment share in both Global Retail and IT still reside in physical stores and on-premises datacenters; and as this equation steadily flips, we believe our leading customer experiences in these areas along with the results of our continued hard work and invention to improve every day, will lead to significant growth in the coming years.
When you also factor in our investments and innovation in several other broad customer experiences (e.g. streaming entertainment, customer-first healthcare, broadband satellite connectivity for more communities globally), there’s additional reason to feel optimistic about what the future holds.”
My Takeaway
There’s a lot to unpack here — specifically, their AWS business segment.
Starting with AWS — the business segment grew +20% YoY, with sales coming in at $21.4 billion. This represents a run rate of more than $85B. Amazon stated they began to notice AWS growth slowing as enterprises were optimizing their spend during the second-half of 2022 — and this trend is likely to continue throughout 2023.
Management disclosed to us during their earnings call that AWS revenue growth is trending in the “mid-teens” for Q1— if this trend continued throughout 2023 AWS would land around $100B in revenue for the year.
Next, their $2.7B in operating income includes ~$3B in employee severance, impairments of property and equipment, self-insurance, and operating lease changes. If they did not have to incur this impact, their “normal” operating income would have been $5.4B.
Not a trend, just a hiccup.
Specifically, -$640M in employee sewerage, -$720M in “breaking leases” for their Amazon Fresh and Amazon Go physical stores, and -$1.3B in “self-insurance” reserves. They also mentioned their $278M in net income includes a -$2.3B non-cash non-operating loss from their equity position in Rivian Automotive (RIVN).
Despite free cash flow remaining in the negative territory during the quarter, operating cash flow is slated to move up and to the right.
Because, and only because, Amazon’s stock price has historically followed so closely to operating cash flow (the blue line above) I will continue to be a shareholder and accumulate more shares at these prices.
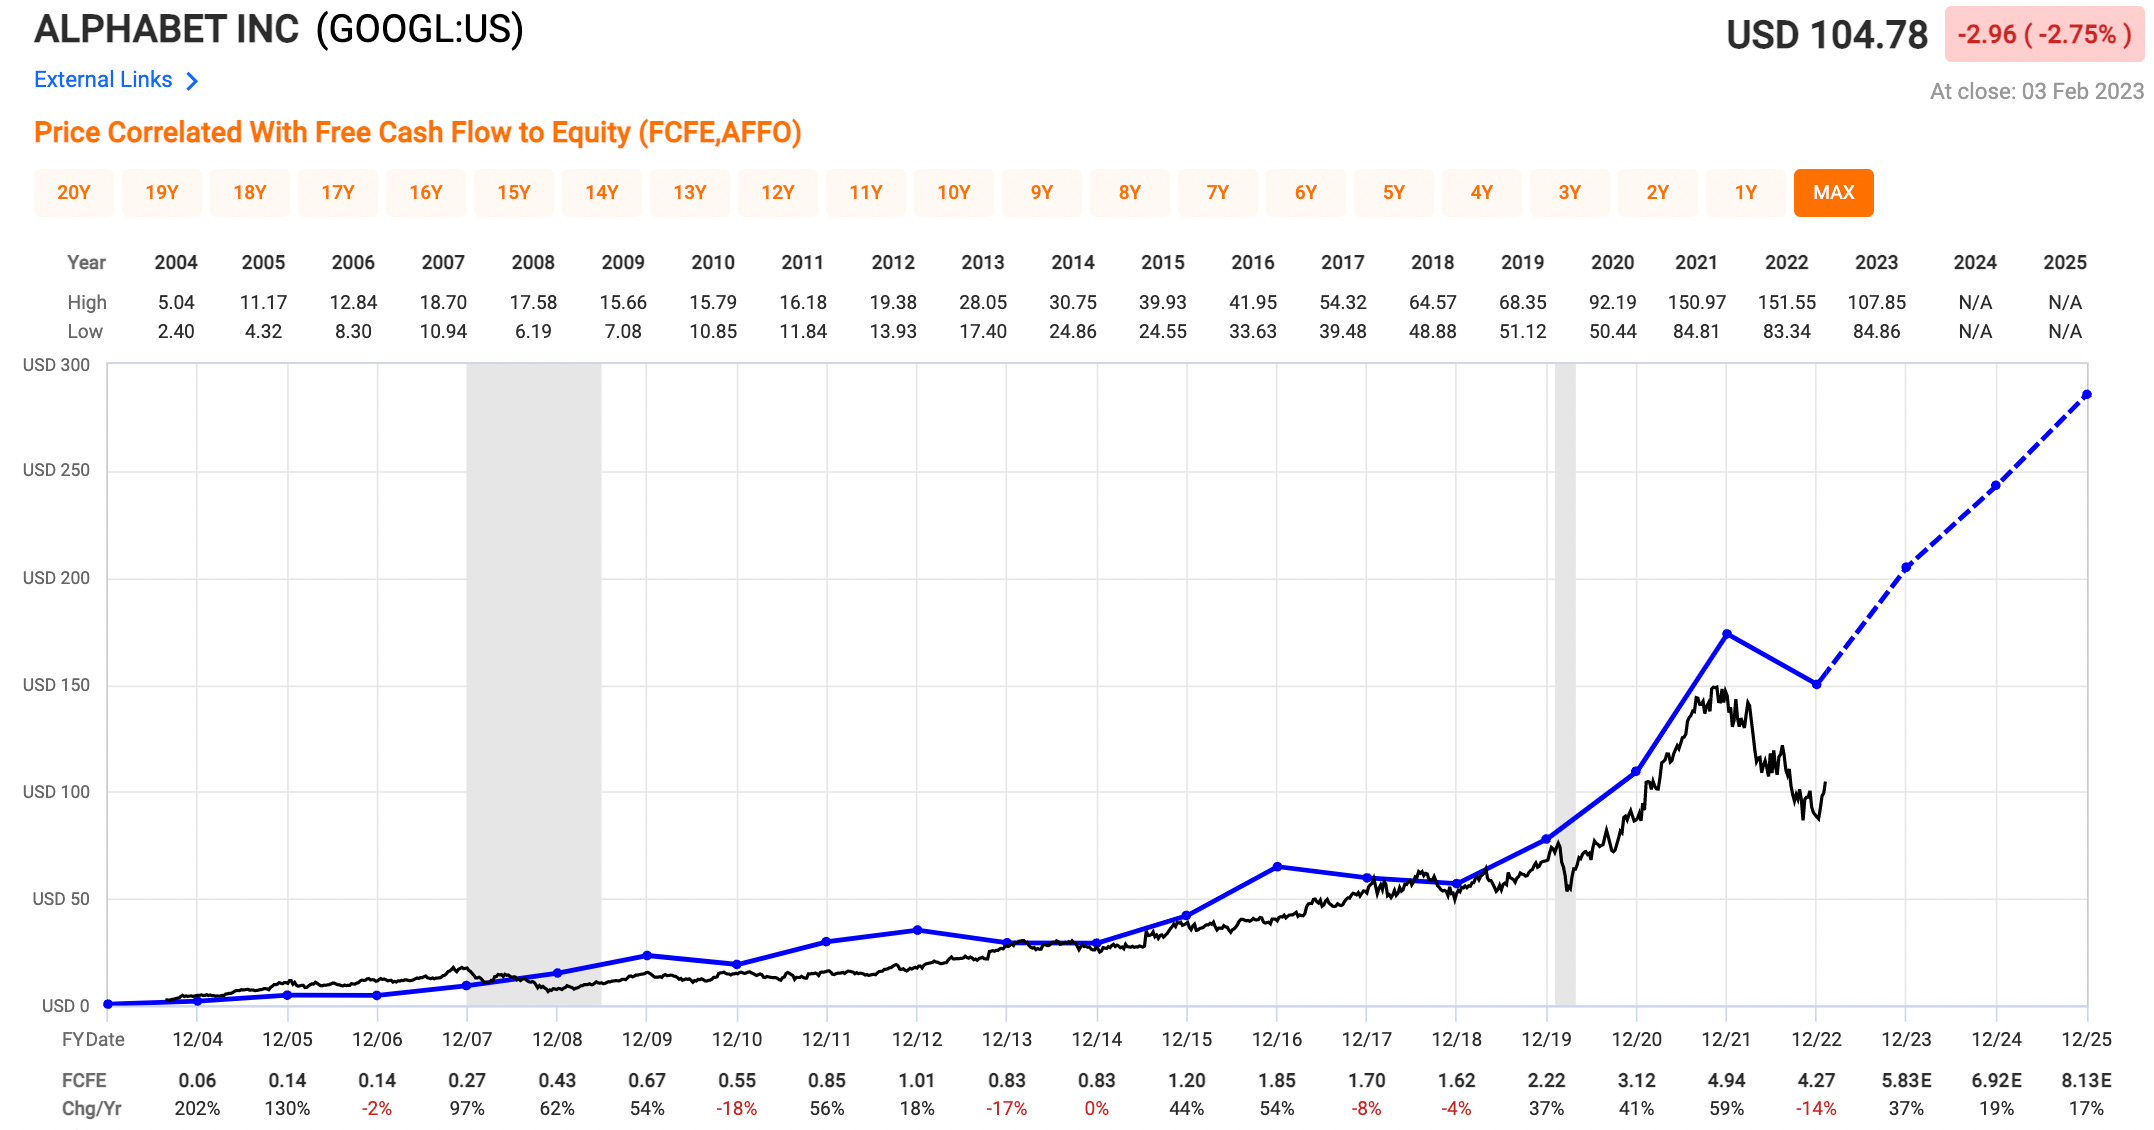
Alphabet (GOOGL)
Key Metrics
Revenue: $76.0 billion, an increase of +1% YoY
Operating Income: $18.1 billion, compared to $21.9 billion last year
Profits: $13.6 billion, compared to $20.6 billion
Earnings Release Callout
“We’re on an important journey to re-engineer our cost structure in a durable way and to build financially sustainable, vibrant, growing businesses across Alphabet.”
My Takeaway
I continue to believe the “theme” for a lot of companies in 2023 will be efficiency and cost optimization — both on the operational side, as well as on the revenue side. We saw this from Amazon (layoffs paired with lower AWS revenue), and we’re beginning to see it with Google as well.
As stated by Google’s CEO, a sharp focus of investing responsibly while identifying areas for cost optimization is the goal for 2023.
However, an under-appreciated part of this cost optimization story is their Google Cloud business segment — having realized a +32% increase in revenue during the quarter to $7.3B. This business segment will soon be a $40B / year business for Google. Once profitable and scaled to the tune of AWS — this business segment will generate $10B+ in operating income for Google.
I’ll continue to hold and accumulate more shares of Google, especially after seeing their free cash flow growth profile over the coming years (below).